TL;DR: enter your values in "entries", connect the data preparator with the outputs from job-builder to the inputs of your workflow, and enjoy your xy plot
Making XY plot grids in A1111 is very easy. Just enter a comma-separated list of values and everything else happens automatically. I always found XY plots in ComfyUI a hazzle by comparison. There are two popular XY plot solutions, but I found none of them work nicely together with ComfyUI: qq-nodes-comfyui collects images over multiple runs and tinyterraNodes uses it's own sampler. None of them make use of the execution inversion (because it's very confusing and there are not many node packs and examples which make use of it) but it would allow to make multiple runs in one go. This workflow combines job-iterator with images-grid to build XY plots from a list of values, saves all the intermediate images with nice filenames and builds the grid.
This workflow is split into three groups which you should build your workflow around:
the job builder: takes semicolon-separated list of values to make multiple runs over all combinations
data preparator: allows customizations with the current values for your workflow (such as customizable prompts, customizable filenames or iterations over ranges)
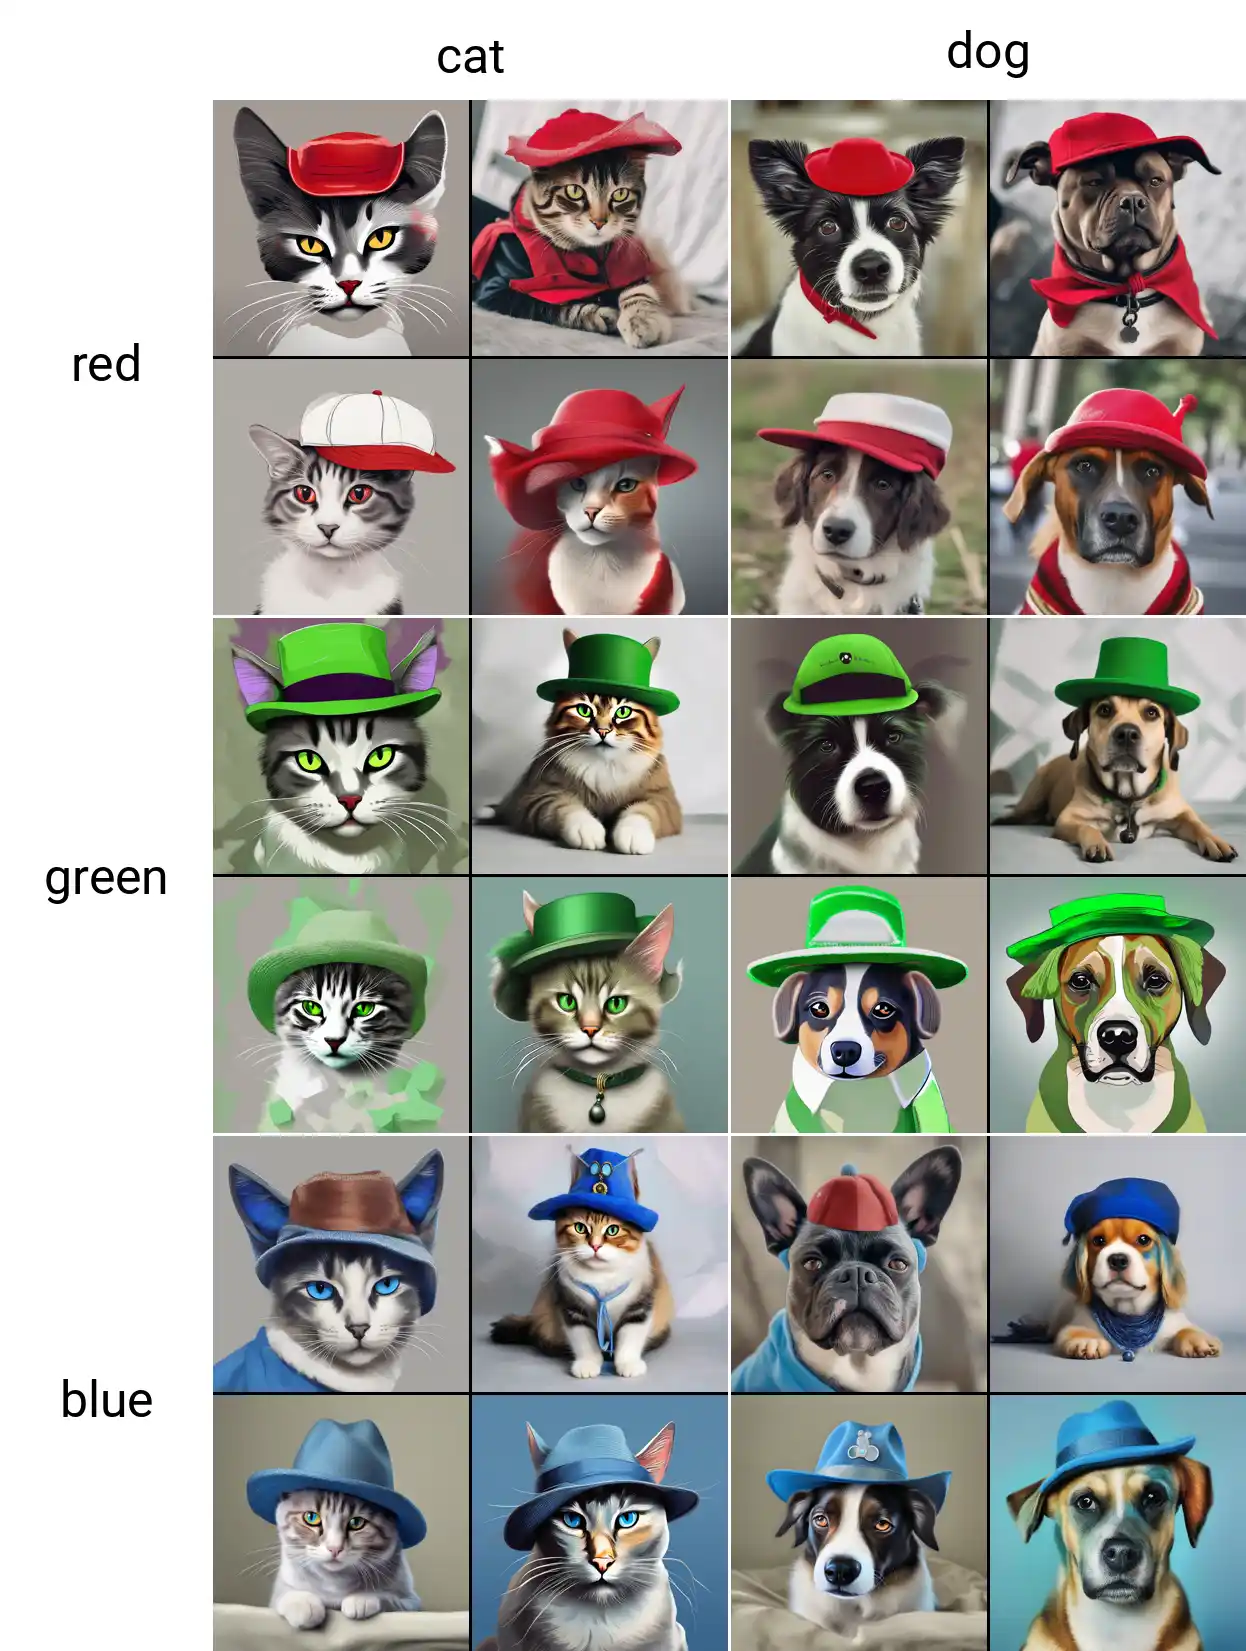
and the grid builder: collects all runs and makes the annotated XY plot grid
custom nodes required:
https://github.com/LEv145/images-grid-comfy-plugin a simple XY plot grid node pack
https://github.com/ali1234/comfyui-job-iterator for execution inversion (it's not very popular yet but it's the only implementation of execution inversion were I actually understood what's going on)
https://github.com/WASasquatch/was-node-suite-comfyui for string manipulation and building sub-grids
https://github.com/pythongosssss/ComfyUI-Custom-Scripts for math operations and debugging